


 9 / 116

avoid a stronger decline of sales for the year just passed.
There were considerable differences in sales over the na-
tional average in the individual regions bucking the downward
trend. Tractor registrations climbed 5.3% in Lombardy, rose
9.7% in Piedmont, 2% in the Veneto and shot up 27.4% in
Emilia Romagna, whereas the steepest drops came in Cam-
pania, down 19.1%, and Puglia, off by 14.2%.
FederUnacoma President Massimo Goldoni commented,
“The Rural Development Plans are still the leading instru-
ment of incentives for acquiring agricultural machinery and
we hope they go along at full regime over the year and have
a positive impact on the final balance sheet. On the other
hand, we will not have the drive expected with the applica-
tion of the INAIL, Italian National Institute for Insurance
against Accidents at Work, incentives, because the deadline
for filing requests has been extended from January 20 to
April 28. This probably involves blocking purchases over the
first part of the year.
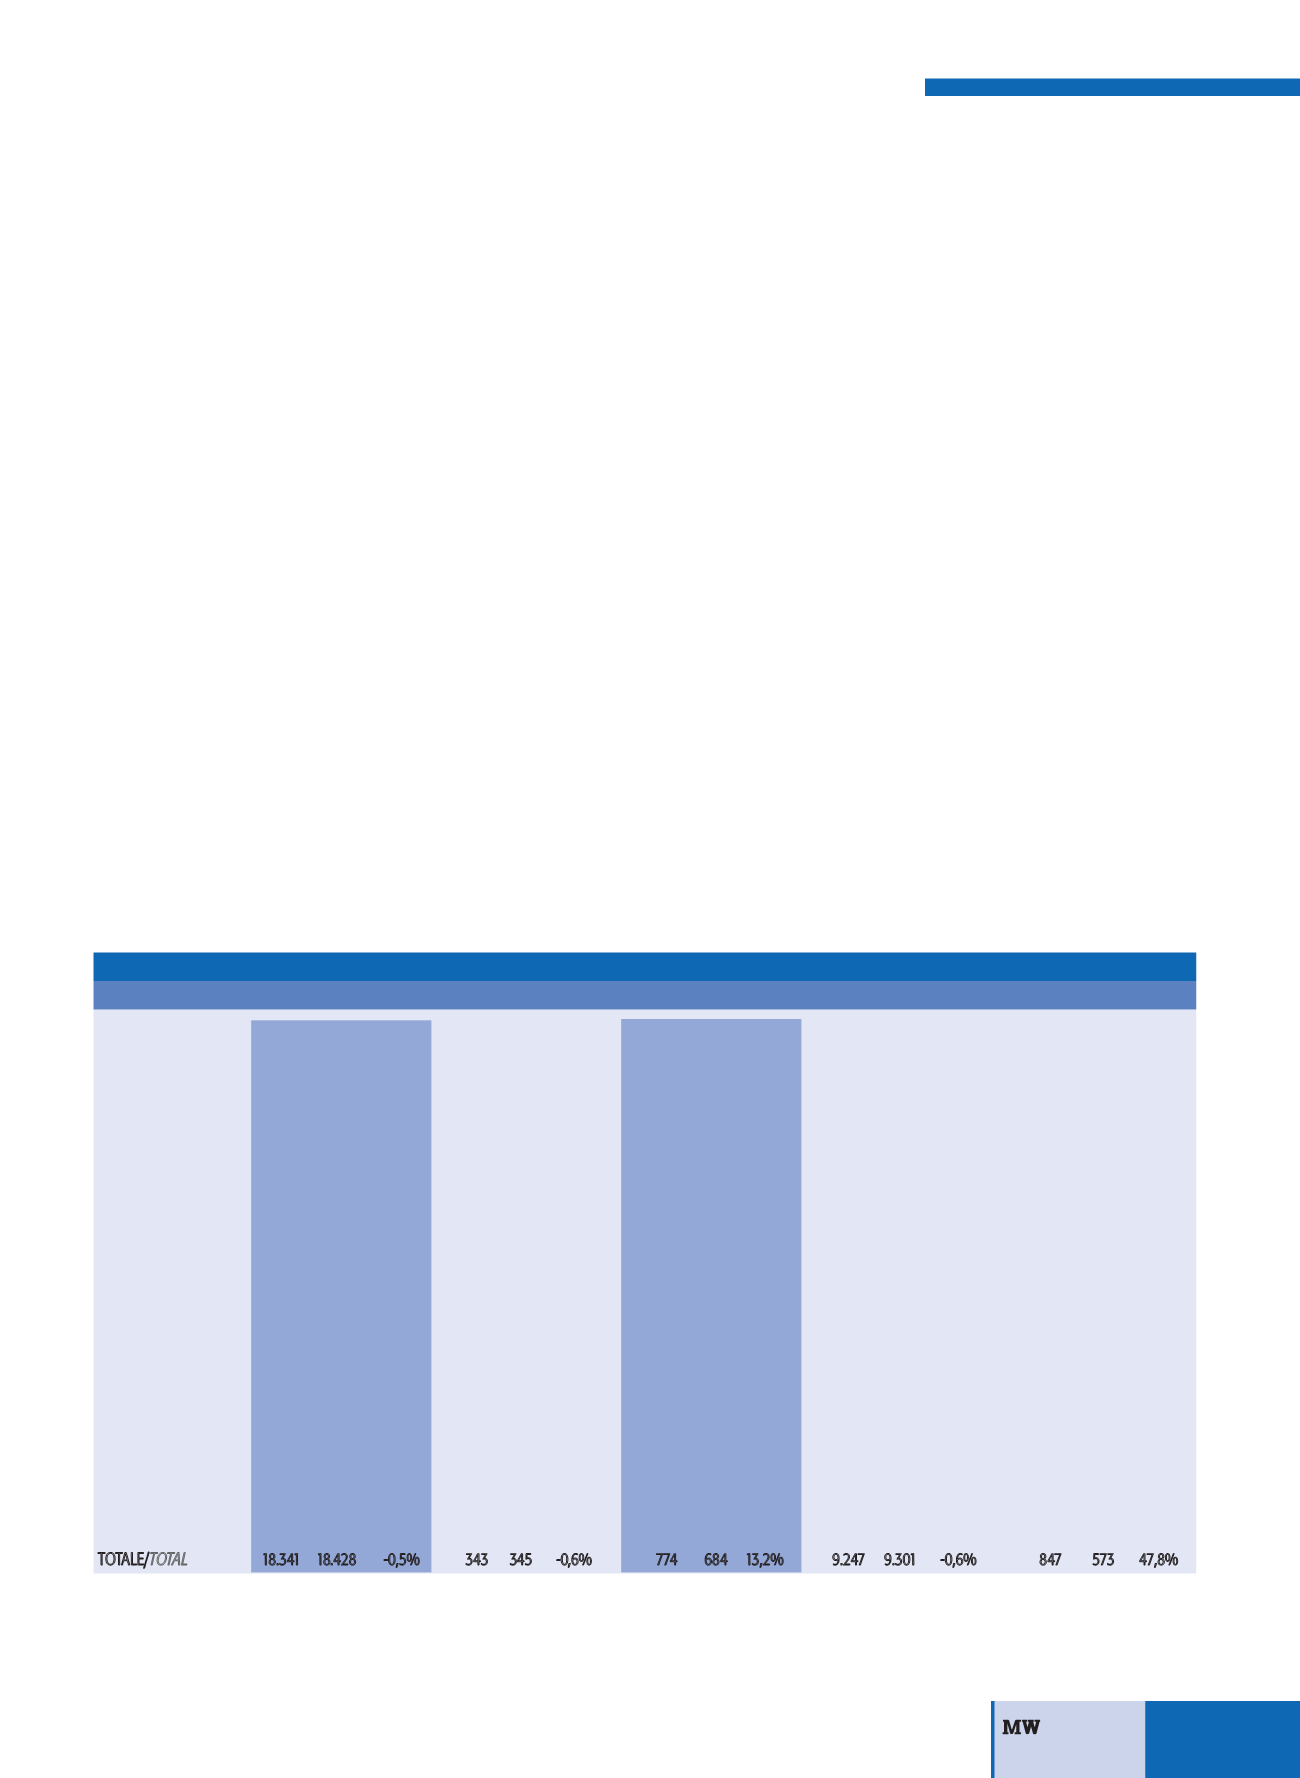
Data on the registration of tractors, combine harvesters and trailers disclosed a marginal decline
compared to 2016 to further confirm the lengthy slide of the domestic market. Sales increases were
reported only for transporters and agricultural telescopic handlers. Tractor sales running counter to the
national data trend came in the major northern regions
7
n. 1-2/2017
là del dato medio nazionale, l’andamento delle immatricolazioni nel-
le singole Regioni si presenta notevolmente differenziato, con i prin-
cipali mercati in controtendenza: le immatricolazioni di trattrici se-
gnano infatti una crescita del 5,3% in Lombardia, del 9,7% in Pie-
monte, del 2% in Veneto e addirittura del 27,4% in Emilia Roma-
gna; mentre un vistoso passivo registrano le immatricolazioni in
Campania (-19,1%) e in Puglia (-14,2%).
«I Piani di Sviluppo Rurale PSR restano il principale strumen-
to per incentivare l’acquisto di macchine agricole – commen-
ta il presidente di FederUnacoma Massimo Goldoni – e spe-
riamo possano andare a regime nel corso dell’anno e incide-
re in modo positivo nel bilancio conclusivo». «Nei primi mesi
dell’anno non avremo invece la spinta che ci si aspettava dal-
l’entrata in vigore degli incentivi Inail – aggiunge Goldoni – per-
ché i termini per la presentazione delle domande sono stati
prorogati di tre mesi, dal 20 gennaio al 28 aprile. Questo com-
porterà un probabile blocco degli acquisti in questa prima par-
te dell’anno».
Italy:
tractors balance 2016
at a
minimum
MERCATO
|
MARKET
TRATTRICI
MIETITREBBIATRICI
TRATTRICI CON PIANALE DI CARICO
RIMORCHI
SOLLEVATORI TELESCOPICI
TRACTORS
COMBINE-HARVESTER
TRANSPORTERS
TRAILERS
TELEHANDLERS
REGIONI /
REGIONS
2016
2015
Var. % 2016 2015 Var. %
2016 2015 Var. %
2016 2015 Var. %
2016 2015
Var. %
ABRUZZO
500 462 8,2% *
*
-
30 28 7,1% 324 311 4,2%
0
*
-
BASILICATA
257 451 -43,0% * 11
-
10 10 0,0% 124 183 -32,2%
*
*
-
CALABRIA
637 577 10,4% 0 0
-
44 33 33,3% 302 277 9,0%
*
*
-
CAMPANIA
893 1104 -19,1% *
*
-
43 53 -18,9% 397 477 -16,8%
18
15 20,0%
EMILIA R.
1811 1422 27,4% 34 36 -5,6%
15 11 36,4% 737 718 2,6% 106 94 12,8%
FRIULI
509 412 23,5% * 11
-
9
6 50,0% 257 286 -10,1%
*
16
-
LAZIO
1021 1043 -2,1% *
*
-
23 22 4,5% 534 532 0,4%
13
*
-
LIGURIA
73
88 -17,0% 0 0
-
46 34 35,3%
49 68 -27,9%
*
0
-
LOMBARDIA
1744 1656 5,3% 40 51 -21,6% 115 105 9,5% 910 835 9,0% 234 162 44,4%
MARCHE
454 704 -35,5% 37 25 48,0%
6
4 50,0% 200 251 -20,3%
17
*
-
MOLISE
152 155 -1,9% * 10
-
6
5 20,0%
96 114 -15,8%
*
*
-
PIEMONTE
2401 2188 9,7% 85 69 23,2% 124 105 18,1% 1182 1140 3,7% 323 115 180,9%
PUGLIA
1297 1511 -14,2% 17 22 -22,7%
7
8 -12,5% 482 547 -11,9%
30 30 0,0%
SARDEGNA
269 706 -61,9% 0 *
-
0
2 -100,0% 151 272 -44,5%
*
*
-
SICILIA
1513 1509 0,3% 26 25 4,0%
35 19 84,2% 735 581 26,5%
*
15
-
TOSCANA
1213 979 23,9% 19 11 72,7%
49 43 14,0% 413 462 -10,6%
*
17
-
TRENTINO
1022 880 16,1% 0 0
-
113 105 7,6% 806 752 7,2%
17
*
-
UMBRIA
429 433 -0,9% 12 *
-
9 10 -10,0% 178 132 34,8%
*
*
-
VALLE D'AOSTA
40
83 -51,8% 0 0
-
2 14 -85,7%
22 65 -66,2%
*
*
-
VENETO
2106 2065 2,0% 37 48 -22,9%
88 67 31,3% 1348 1298 3,9%
89 109 -18,3%
TOTALE/
TOTAL
18.341 18.428 -0,5% 343 345 -0,6% 774 684 13,2% 9.247 9.301 -0,6% 847 573 47,8%
IMMATRICOLAZIONI GENNAIO-DICEMBRE 2016
REGISTRATIONS JANUARY-DECEMBER 2016
Dati Ministero Trasporti - Elaborazioni Ufficio Statistico FEDERUNACOMA
Ministry of Transport Data processed by FEDERUNACOMA Statistical Dept.
* Dati oscurati per adempiere ai dettami comunitari in merito alla divulgazione di elaborazioni statistiche in mercati oligopolistici
* Figures encoded in order to comply with the European Commission requirements concerning the publication of statistical data within oligopolistic markets
** Ad uso agricolo
/
For agricultural use