


 8 / 216

liardi di dollari il valore delle importazioni nel 2015), segui-
ti dalla Francia (quasi 2,2 miliardi), e quindi da Canada e
Germania (entrambi intorno agli 1,2 miliardi) e con quote de-
crescenti Regno Unito, Belgio, Australia. Per quanto riguar-
da le altre tipologie di macchine, la classifica dei “big im-
porters” vede sempre al primo posto gli Stati Uniti (10,7 mi-
liardi di dollari il valore delle importazioni nel 2015), segui-
ti da Germania (poco meno di 5 miliardi) e quindi, con quo-
te inferiori, da Francia, Canada, Regno Unito e Cina. Tutto
questo dimostra come i Paesi che sono grandi produttori di
macchine agricole non per questo sono meno interessanti
come sbocchi di mercato, rivelandosi anzi forti importatori
proprio per le dinamiche tipiche delle economie più svilup-
pate. Se, al di là dei volumi d’importazione assoluti, si ana-
lizzano i dati riguardanti i maggiori tassi di crescita delle im-
portazioni, quella che emerge è una geografia degli scambi
nuova e in fermento. Nei sei anni dal 2010 al 2015 il Pae-
se che ha registrato il maggiore incremento nelle importa-
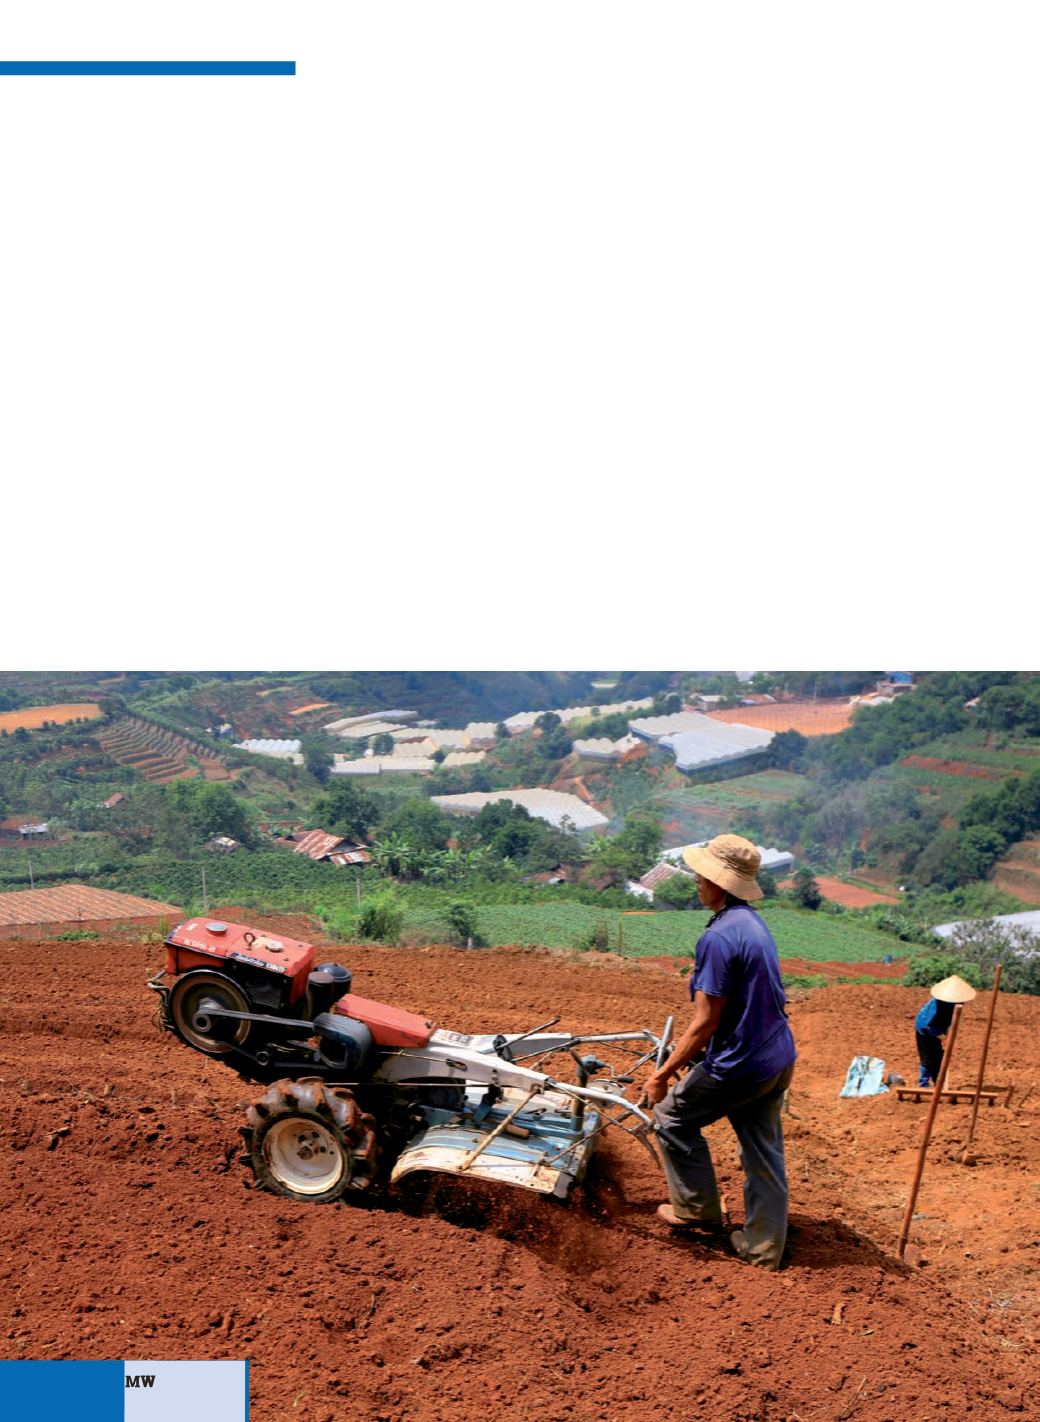
zioni di trattrici è Cuba (870% di crescita), seguito dalle Fi-
lippine (+580%) e dal Vietnam (+400%). Paesi asiatici ai pri-
mi posti anche per quanto riguarda le macchine agricole ope-
ratrici e le attrezzature, con Vietnam, Cambogia e Sri Lanka
ai primi tre posti. Il monitoraggio dei nuovi mercati realizza-
to da FederUnacoma/Nomisma ha una fondamentale im-
portanza per le industrie costruttrici che puntano ad esten-
dere il proprio raggio d’attività, e suscita particolare inte-
resse presso le industrie italiane, chiamate a diversificare
point, FederUnacoma, the Italian Agricultural Machinery
Manufacturers Federation, called on Nomisma for con-
ducting a survey of the countries with strong records of im-
ports of tractors and other agricultural machinery to high-
light the areas of greatest interest for the future prospects
of the manufacturing industries at the present time.
Conclusive data on the volumes of tractor imports indicate
that the United States is in the lead with a value of nearly
$ 4 billion, followed by France at close to $ 2.2 billion, then
Canada and Germany at around $ 1.2 billion each and on
down to the United Kingdom, Belgium and Australia. For
other types of agricultural machinery, the classification of
the big importers is again headed by the United States with
a value of $ 10.7 billion, followed by Germany at just un-
der $ 5 billion and then down to France, Canada, the UK
and China. All this shows that the major countries produc-
ing agricultural machinery are nonetheless interested in
market outlets and are strong importers due to the the dy-
namics typical of the most developed countries’ economies.
Analyses of data on the largest import growth rates, beyond
the volume of imports, disclose the geography of new trade
trends in turbulence. Over the six year period 2010 to 2015
the country with the sharpest increase in tractor imports
was Cuba with growth of 870%, followed by Philippines
(580%) and Vietnam (+400%). Asian countries also led for
other types of agricultural machinery and equipment with
Vietnam, Cambodia and Sri Lanka as the top three. Moni-
6
n. 10-11/2016
PRIMO PIANO