


 9 / 116

avoid a stronger decline of sales for the year just passed.
There were considerable differences in sales over the na-
tional average in the individual regions bucking the downward
trend. Tractor registrations climbed 5.3% in Lombardy, rose
9.7% in Piedmont, 2% in the Veneto and shot up 27.4% in
Emilia Romagna, whereas the steepest drops came in Cam-
pania, down 19.1%, and Puglia, off by 14.2%.
FederUnacoma President Massimo Goldoni commented,
“The Rural Development Plans are still the leading instru-
ment of incentives for acquiring agricultural machinery and
we hope they go along at full regime over the year and have
a positive impact on the final balance sheet. On the other
hand, we will not have the drive expected with the applica-
tion of the INAIL, Italian National Institute for Insurance
against Accidents at Work, incentives, because the deadline
for filing requests has been extended from January 20 to
April 28. This probably involves blocking purchases over the
first part of the year.
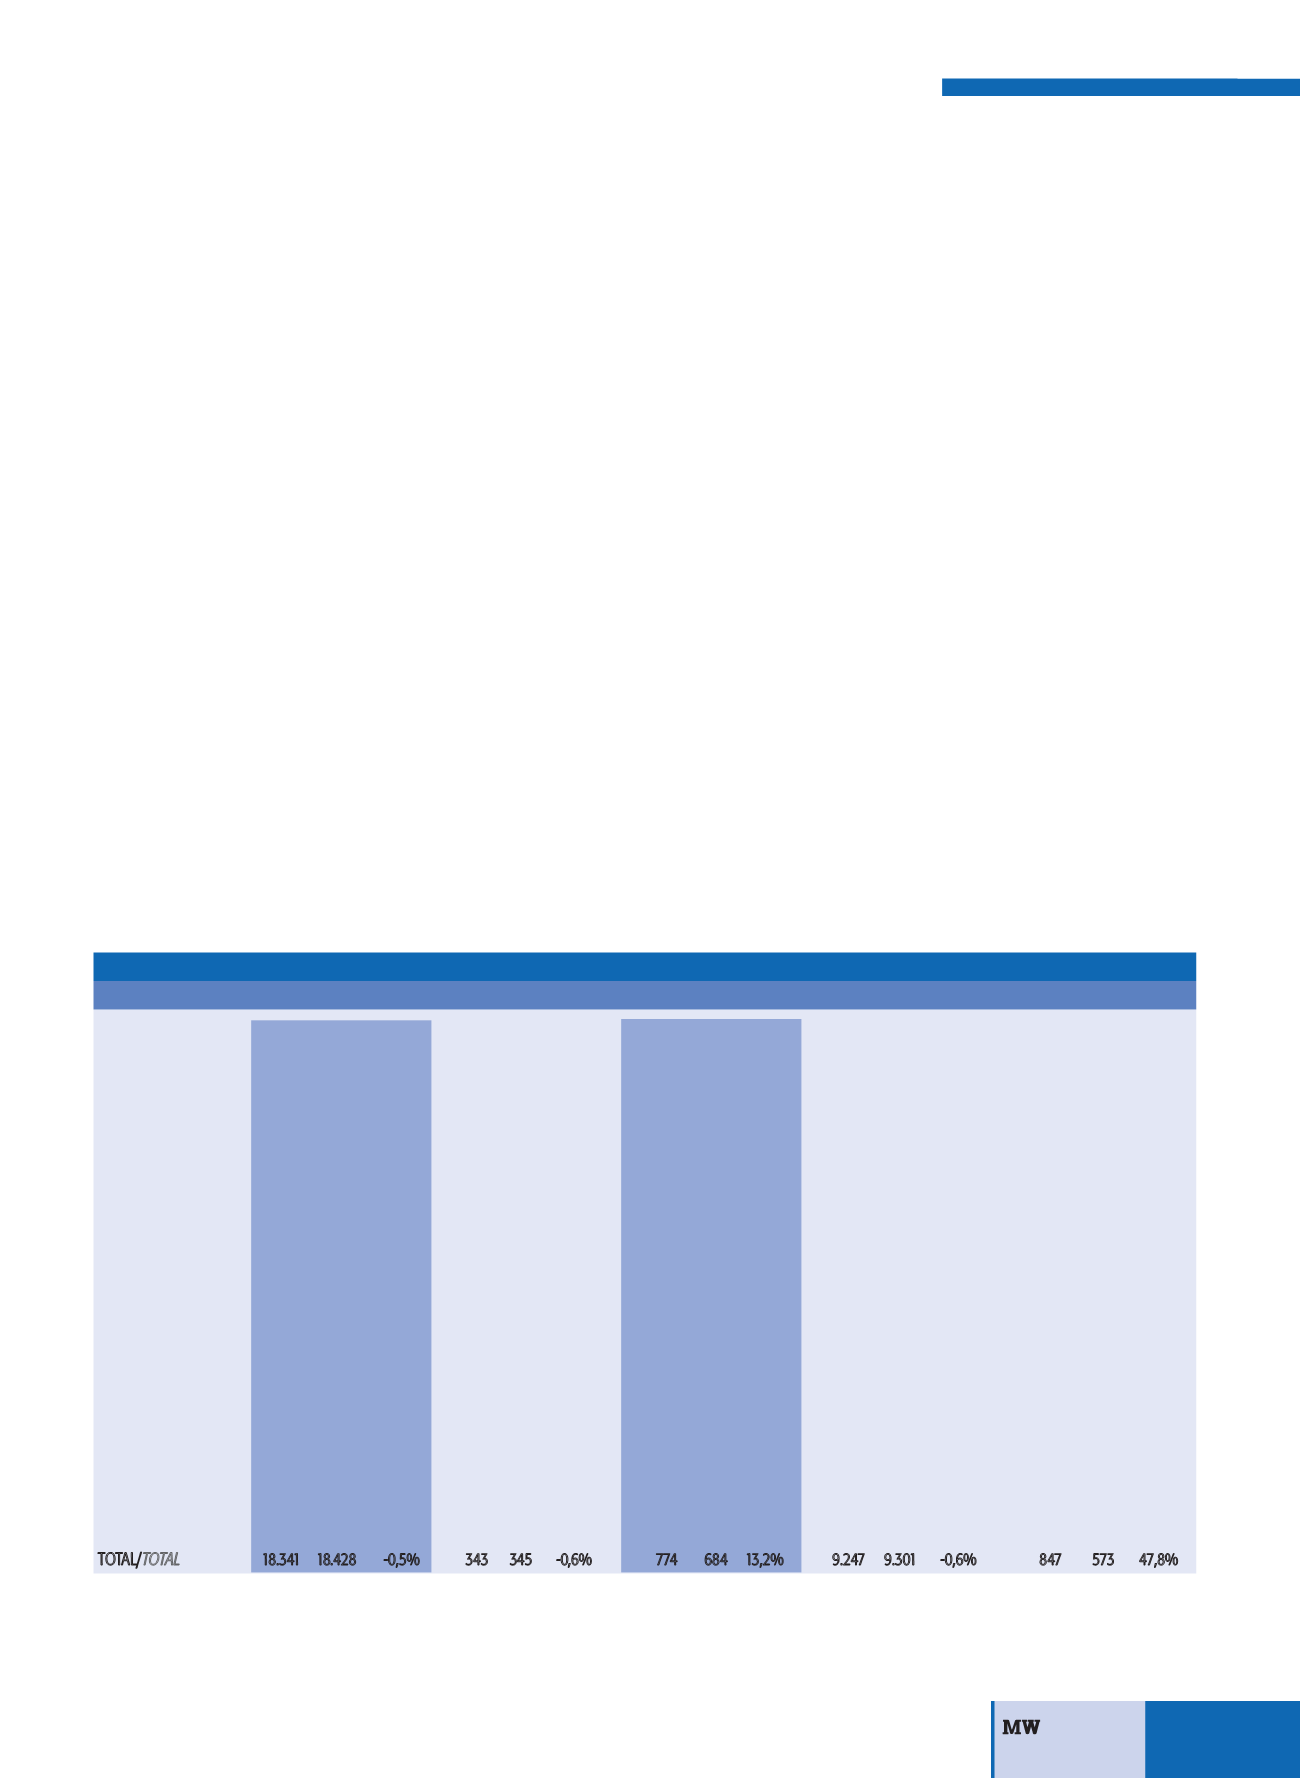
Data on the registration of tractors, combine harvesters and trailers disclosed a marginal decline
compared to 2016 to further confirm the lengthy slide of the domestic market. Sales increases were
reported only for transporters and agricultural telescopic handlers. Tractor sales running counter to the
national data trend came in the major northern regions. Tractor sales running counter to the national
data trend came in the major northern regions
7
n. 1-2/2017
construction et par les réseaux de vente pour favoriser les achats avant
la clôture de l’année – a empêché un passif plus lourd. Au-delà des
données moyennes nationales, l’allure des immatriculations dans cha-
que région est bien différente, avec les principaux marchés en contre-
tendance : les immatriculations de tracteurs signent en effet une crois-
sance de 5,3% en Lombardie, de 9,7% en Piémont, de 2% en Vénétie
et carrément de 27,4% en Emilie Romagne ; tandis que les immatri-
culations en Campanie (-19,1%) et dans les Pouilles (-14,2%) enregi-
strent un passif évident. « Les Plans de Développement Rural PSR re-
stent l’instrument principal pour favoriser l’achat de machines agrico-
les – commente le Président de FederUnacoma Massimo Goldoni – et
nous espérons passer à plein régime au cours de l’année et avoir une
influence positive dans le bilan de conclusion ». « Au cours des pre-
miers mois de l’année, nous n’aurons par contre pas le coup de pou-
ce que l’on attendait de l’entrée en vigueur des aides INAIL - ajoute Gol-
doni – car les délais pour la présentation des demandes ont été pro-
longés de trois mois, du 20 janvier au 28 avril. Ceci entrainera un pos-
sible blocage des achats au cours des premiers mois de l’année.
Italy:
tractors balance 2016
at a
minimum
MARCHÉ
|
MARKET
TRACTEURS
MOISSONNEUSES
TRACTEURSAVECPLATEFORMEDECHARGEMENT
REMORQUES
ELEVATEURS TELESCOPIQUES**
TRACTORS
COMBINE-HARVESTER
TRANSPORTERS
TRAILERS
TELEHANDLERS
REGIONS /
REGIONS
2016
2015
Var. % 2016 2015 Var. %
2016 2015 Var. %
2016 2015 Var. %
2016 2015
Var. %
ABRUZZES
500 462 8,2% *
*
-
30 28 7,1% 324 311 4,2%
0
*
-
BASILICATE
257 451 -43,0% * 11
-
10 10 0,0% 124 183 -32,2%
*
*
-
CALABRE
637 577 10,4% 0 0
-
44 33 33,3% 302 277 9,0%
*
*
-
CAMPANIE
893 1104 -19,1% *
*
-
43 53 -18,9% 397 477 -16,8%
18
15 20,0%
EMILIE R.
1811 1422 27,4% 34 36 -5,6%
15 11 36,4% 737 718 2,6% 106 94 12,8%
FRIOUL
509 412 23,5% * 11
-
9
6 50,0% 257 286 -10,1%
*
16
-
LATIUM
1021 1043 -2,1% *
*
-
23 22 4,5% 534 532 0,4%
13
*
-
LIGURIE
73
88 -17,0% 0 0
-
46 34 35,3%
49 68 -27,9%
*
0
-
LOMBARDIE
1744 1656 5,3% 40 51 -21,6% 115 105 9,5% 910 835 9,0% 234 162 44,4%
MARCHES
454 704 -35,5% 37 25 48,0%
6
4 50,0% 200 251 -20,3%
17
*
-
MOLISE
152 155 -1,9% * 10
-
6
5 20,0%
96 114 -15,8%
*
*
-
PIEMONT
2401 2188 9,7% 85 69 23,2% 124 105 18,1% 1182 1140 3,7% 323 115 180,9%
POUILLES
1297 1511 -14,2% 17 22 -22,7%
7
8 -12,5% 482 547 -11,9%
30 30 0,0%
SARDAIGNE
269 706 -61,9% 0 *
-
0
2 -100,0% 151 272 -44,5%
*
*
-
SICILE
1513 1509 0,3% 26 25 4,0%
35 19 84,2% 735 581 26,5%
*
15
-
TOSCANE
1213 979 23,9% 19 11 72,7%
49 43 14,0% 413 462 -10,6%
*
17
-
TRENTIN
1022 880 16,1% 0 0
-
113 105 7,6% 806 752 7,2%
17
*
-
OMBRIE
429 433 -0,9% 12 *
-
9 10 -10,0% 178 132 34,8%
*
*
-
VAL D'AOSTE
40
83 -51,8% 0 0
-
2 14 -85,7%
22 65 -66,2%
*
*
-
VENETIE
2106 2065 2,0% 37 48 -22,9%
88 67 31,3% 1348 1298 3,9%
89 109 -18,3%
TOTAL/
TOTAL
18.341 18.428 -0,5% 343 345 -0,6% 774 684 13,2% 9.247 9.301 -0,6% 847 573 47,8%
IMMATRICULATIONS JANVIER-DECEMBRE 2016
REGISTRATIONS JANUARY-DECEMBER 2016
Données Ministère Transports - Elaborations Bureau Statistiques FEDERUNACOMA
Ministry of Transport Data processed by FEDERUNACOMA Statistical Dept
* Données codées pour respecter les critères communautaires concernant la publication de statistiques dans les marchés oligopolitiques
* Figures encoded in order to comply with the European Commission requirements concerning the publication of statistical data within oligopolistic markets
** A usage agricole
/
For agricultural use