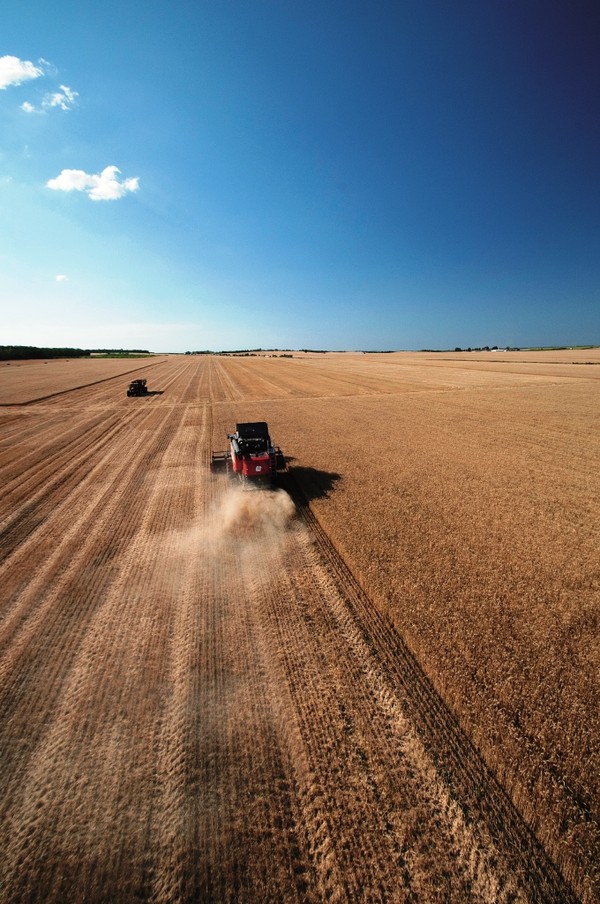
Agricultural production: precision mapping
Electronic, computer and satellite technologies make it possible to assess the productive results of each small parcel of land, and thus divide the land into sub-areas that have uniform characteristics and can therefore be treated and managed in differentiated ways. Scientific studies and experiences gained especially in the United States have made this technology particularly reliable in the cereal sector
Precision farming is an increasingly topical issue due to the productive and economic benefits it can bring, besides the undoubted benefits of an environmental nature resulting from a more rational use of technical means (fertilizers, fertilizers, irrigation). The implementation of precision farming provides for significant investment within farms, which can also be supported by the professional offerings from subcontracting. This is certainly the case for the mapping of crops, since farms often use machines not from their own fleet to gather data.
The main objective of crop maps is to know the productive uniformity of a parcel in order to: assess the economic viability of the subdivision into sub-areas with uniform crops to be handled with the VRT (Variable Rate Technology); calculate the removal of nutrients in the sub-areas, draft prescription maps, then proceed with the targeted fertilization of individual sub-areas; assess whether previously-applied VRT techniques have uniformed the production of sub-areas.
The following is a brief state of the art of the main technologies used to map crops at harvest time.
Cereal crop monitoring
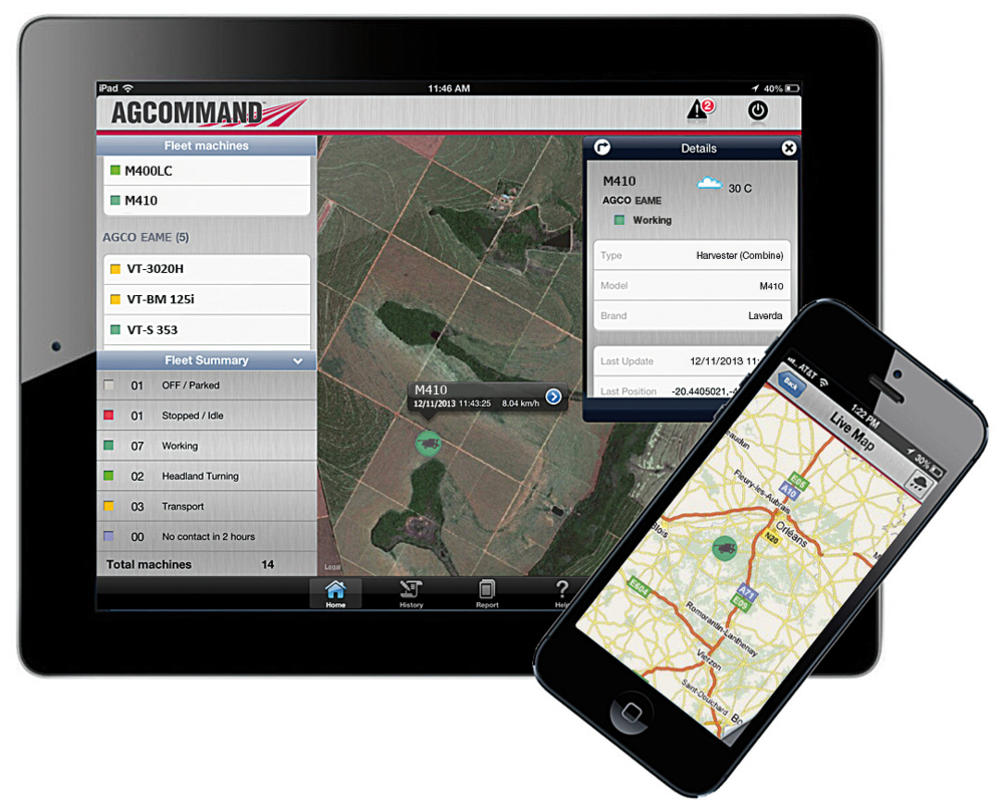
Among the mapping systems for agricultural production, the most consolidated ones in terms of reliability and prevalence are undoubtedly those dedicated to cereals. The first uses of these methods date back to the 1980s, in the United States, where today they are widely practiced. In 2015, over 60% of US farmers made use of crop mapping data (Erickson and Widmar, 2015). In order to monitor crops, multiple tools work simultaneously, and these are integrated by a computer that employs a specific algorithm to provide the georeferenced data (t ha-1).
More specifically, several sensors work together to produce the final data. With adjustable sampling time (in tenths of a second), they measure individual parameters: the quantity and/or quality of the harvested product, the actual working width of the harvesting bar. The latter, multiplied by the speed and linked to the sampling time, will provide the area that the production data refers to. This data is then coupled to the geographic coordinates provided by the localization sensor (GNSS).
As one can well imagine, many technical solutions based on different physical principles have emerged over the last few decades for the construction of the various sensors. Those suitable for measuring crop quantity are defined flow sensors. The most widely used today are volumetric and impact sensors. These are positioned at the end of the elevator carrying the grains into the tank, as they exit the cleaning system. This type of sensor has replaced earlier versions that were less precise and in some cases even hazardous (see gamma-ray radiometric sensors).
Volumetric sensors use the measurement of the volume of the product transported by the individual lift cups, and in order to increase accuracy they are coupled with an optical sensor (which calculates the fill level of the individual cup). To arrive at the final data, this type of sensor also needs a density sensor that takes measurements at regular intervals, for comparison with a volume whose density is known. In contrast, impact sensors are based on the use of a potentiometer that translates into an electrical signal the kinetic energy of the grain that impacts the sensor.
Generally, all flow sensors (volumetric and impact) are coupled with a moisture sensor used to calculate the dry weight of the grain. Other sensors (generally ultrasound) are positioned on the cutting bar in order to assess the height of the bar, interrupt the gathering of data during the manoeuvre operations and measure, as anticipated, the actual harvesting width.
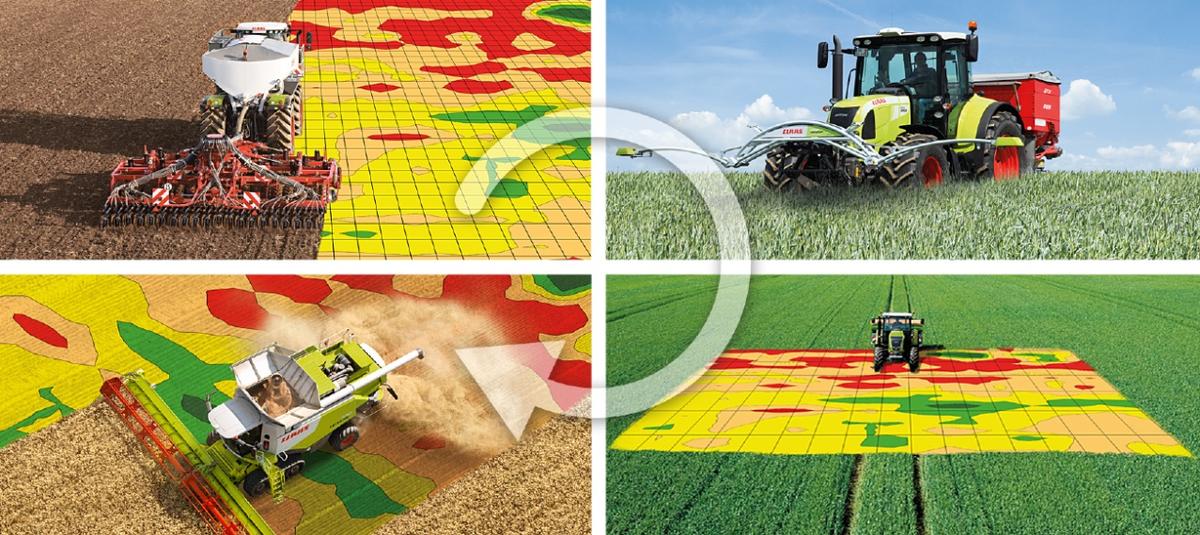
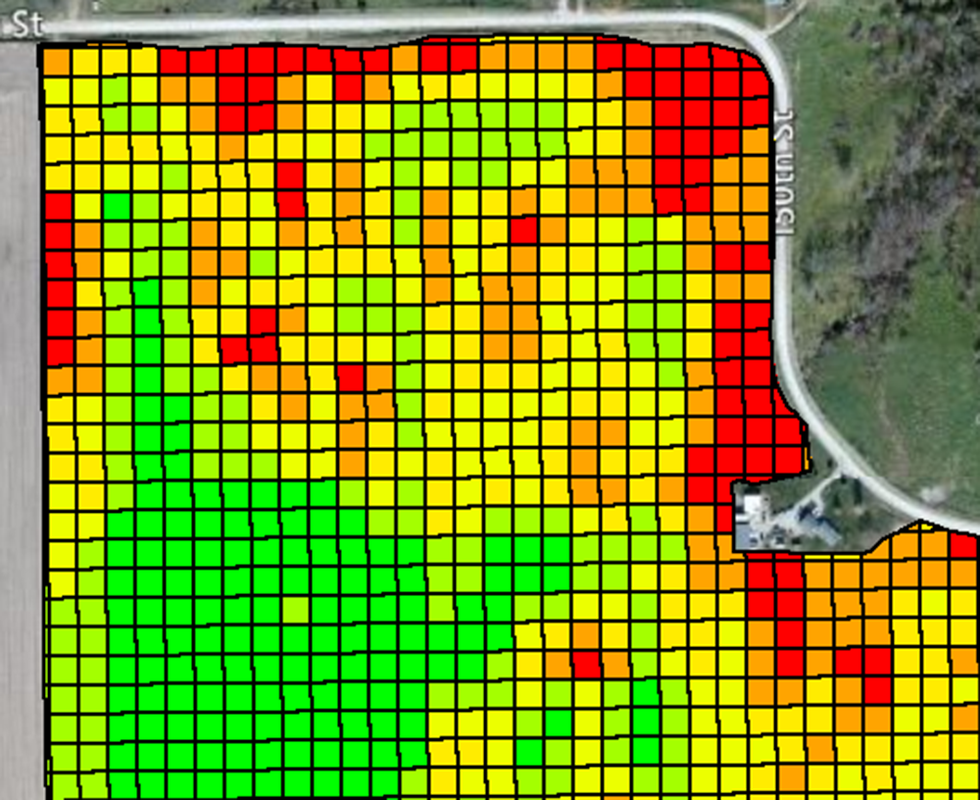
By processing the data of the sensors just described, the system returns a georeferenced map (Figure 1). In this context, the experimentation is currently focused on systems that can also provide qualitative analyses, for example using NIR (Near InfraRed Spectroscopy) sensors, which after appropriate calibration provide real-time data on: humidity, protein, and caryopsis fats.
Field measurement errors
We should not forget that despite the very sophisticated technology used, the final data is always subject to error, and this is the sum of all the errors resulting from the many steps that are difficult to eliminate. There are system errors of the many sensors employed, and those resulting from the slope of the parcel, the harvest losses of the various machine organs, very uneven terrain, and irregular flow due to loosening. Generally, the error on the final data fluctuates between 5 and 10%.
The importance of continuous monitoring
As already mentioned, mapping the crop with sensor-equipped combine harvester has been done for decades. This approach, however, is not sufficient to describe the variability of the production of a given parcel, since it is limited to one type of crop. In the case of a parcel subject to crop rotation, it is necessary to map the production of subsequent crops, such as forage, tubers or horticulture. The technological solutions suitable for this purpose are currently far less developed and hence less widespread.
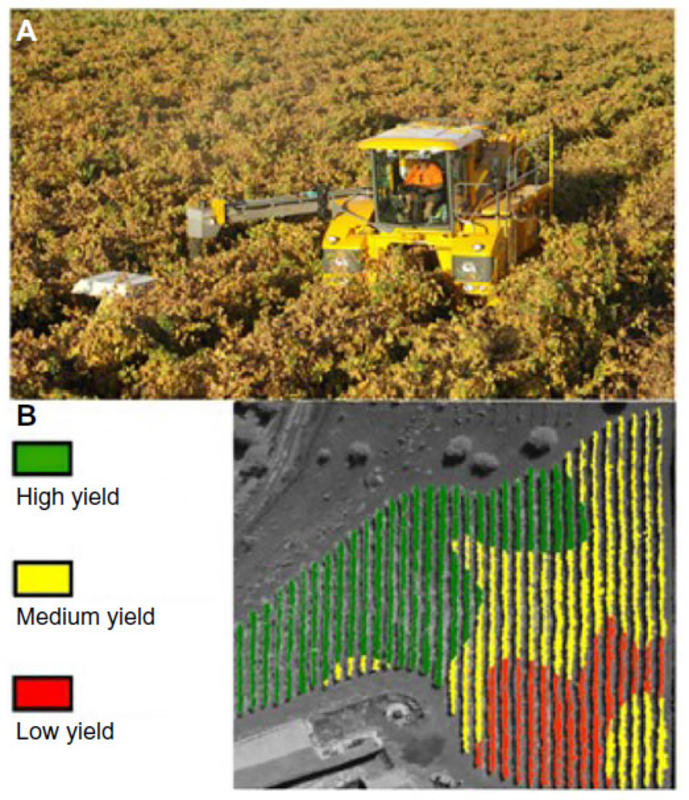
In any case, the balers and loading wagons used for forage can be equipped with sensors that measure the mass of the product. This data can only be coupled with the harvest area needed to fill the machines (balers or wagons), which involves a rather high error rate. Alternatively, sensors can be used directly on the mower conditioner (or on the hoe-loader), which generally give more accurate data. In the case of potatoes, tomatoes or beetroots, load cells positioned under the conveyor belts are generally used, as they are always installed on the harvesting machines for these crops. The same technology is often used on board mechanical harvesters (Figure 2). If these are fitted with optical sensors, in addition to the quantitative data, they are also able to return a mapping of the main quality characteristics of the grape (sugar level, acidity and polyphenol content). The latter sensors are the basis for selective harvesters, machines capable of automatically dividing the crop into different tanks according to certain pre-defined quality characteristics, so that the product can be delivered to the cellar in batches of different quality and economic value.
Several tools for one end
As outlined in the premise, the production mapping can be a useful tool for evaluating the effectiveness of the implemented cultivation techniques and how to correct them in successive vintages. In the first case, the maps can be used to evaluate whether precision farming practices and VRT carried out prior to harvesting have improved the uniformity of the crop and have led to a yield increase (Figure 3). In the second case, however, they can serve as a basis for assessing needs and planning specific interventions (processing, corrections, fertilization) to the sub-areas that have different productivity.
However, it should be emphasized that the production maps alone are not sufficient to prepare operations using precision farming techniques. The above maps are surely part of a set of tools that can lead to the differential management of individual parcels, saving energy, inputs and money, and, by uniforming the crops, achieving greater production.
Undoubtedly, it is important to carry out physical and chemical analyses of the soil in order to explain the variability of the yield, and above all, to set up measures to correct any deficiencies and/or anomalies that are reflected in the productions.
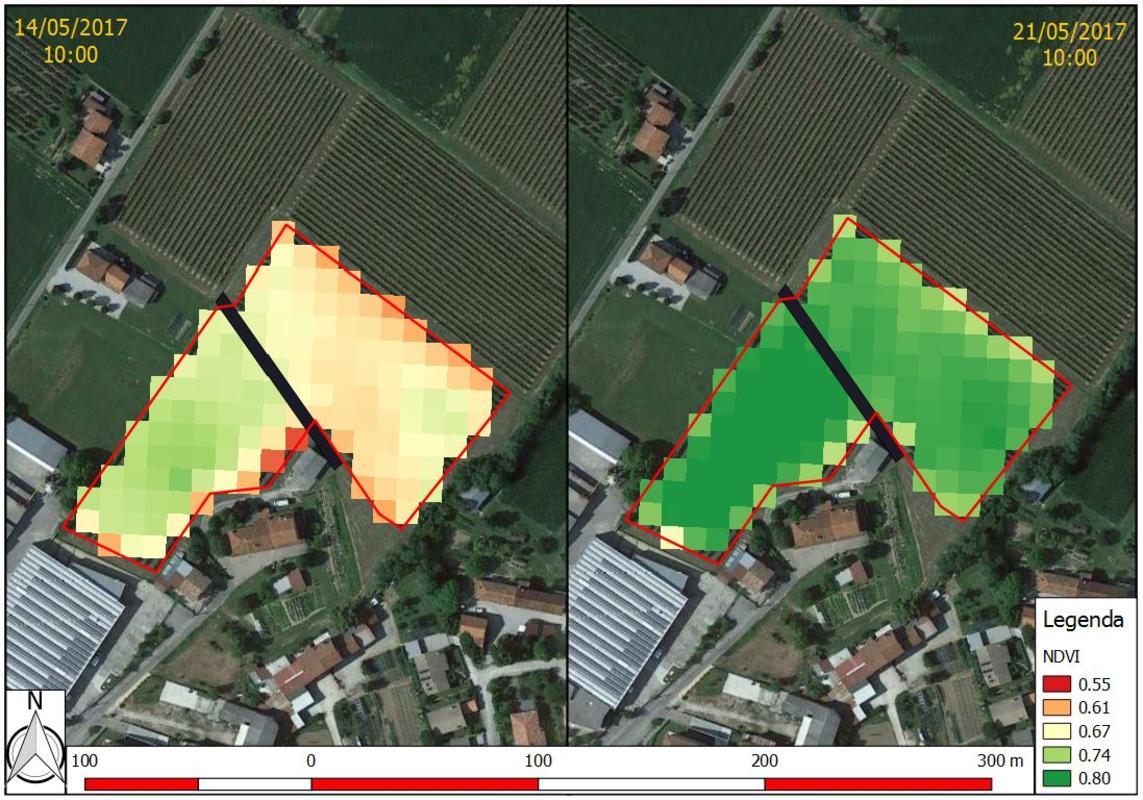
In this context, multi-spectral satellite images allow us to estimate in real or near-real time some vegetation indices capable of discriminating zones with greater or lesser vegetative vigour. The most common of these is undoubtedly the NDVI (Normalized Difference Vegetation Index - Figure 4). From this index, for example, it is possible to highlight nutritional deficiencies or the degree of maturation within a vineyard. The same technology is used on the drones dedicated to crop monitoring, which for obvious reasons return data with higher spatial resolution, but at a higher cost. This technique also allows data from previous years to be to analysed, given the enormous amount of information present in databases, with the ability to evaluate and locate the existence of problems in a given parcel and quickly create its “history”.
In conclusion, the approach to precision farming must include the use of a set of tools which, however, entail a cost to the farm. These tools are available at a fairly low cost compared to the past, but should be chosen with professionalism, based on the farm’s objectives, after careful economic analysis (cost/benefit). Mapping crops without carrying out soil testing and without the use of remote sensing techniques that, when used together, allow for a specific fertilization plan, reduces the benefits to the farm.
Erickson, B., & Widmar, D. A. (2015). Precision agricultural services dealership survey results. Sponsored By CropLife Magazine And The Center For Food And Agricultural Business. Purdue University. Casa, R. (2017). Precision farming. Methods and technologies to improve the efficiency and sustainability of crop systems. Edagricole.


