
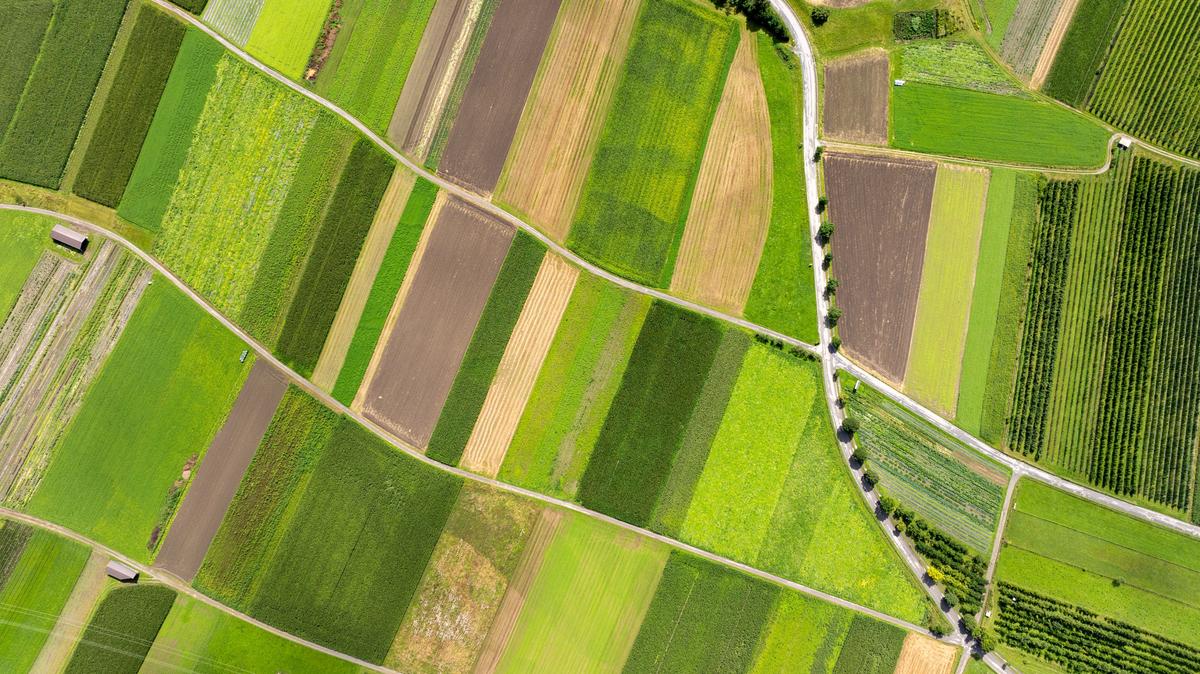
European agriculture, the satellite image of all crops cultivated
For the first time satellite data provides harmonized annual crop maps, providing a detailed tool for assessing crop diversity in Europe. Data of great importance to support the post-2027 Common Agricultural Policy
The climate is changing, crops are varying, landscapes are changing, and European policies are adapting. This is the context in which an interesting report prepared by the European Commission has been published, based on the most recent high-resolution data provided by the Copernicus satellite on crops on the Old Continent. The analysis provides an assessment of crop diversity based on the Copernicus satellite High Resolution Crop Type dataset, which provides continuous annual (wall-to-wall) maps of crops for the EU at 10 meters resolution from 2017 to 2023. The data collected by Copernicus is integrated with the information layers on pastures and with those of the Farm Accountancy Data Network (FADN) processed at farm level. Satellite surveys thus, for the first time, provide high-resolution annual maps of crops from 2017 to 2023, enabling a consistent assessment of biodiversity at both the regional (defined by the Commission as the Nomenclature of territorial units for statistics - NUTS3) and local (the so-called LAUs, Local Administrative Units) scales, providing a complete picture of agricultural land use. The metric used is the Shannon Index, which reflects both the number of crop types present and the distribution of agricultural area between them, capturing diversity at the landscape level. The purpose of this analysis, which identifies dominant specializations, highlights areas of persistently low diversity, and shows regions where diversity has increased or decreased over time, is clear: to support the post-2027 Common Agricultural Policy by examining crop diversity patterns and assessing how crop rotation and diversification, required by both cross-compliance and CAP measures (eco-schemes and agri-environmental-climate commitments), contribute to sustainable agricultural practices.
Diversity indices. Although complex, the method leads to quickly usable data. In brief, the report examines crop diversity at the landscape level (and not crop rotation at the individual farm level). On average, the regions included in the NUTS3 set – which includes, among others, some regions and districts of Austria, France, the Czech Republic and Italy – present around five different crop types (with a mean of 4.6 and a median of 4.9), while at local level (LAU), around 25% of municipalities are located in highly diversified landscapes (over 5.9 different crop types) and, conversely, another 25% are located in low diversity areas (with less than 3.4 crop types) to which is added around 21% of municipalities showing very low diversity (less than 1.5 crop types), indicating a persistent near-monoculture in several areas. These low-diversity areas may arise from highly specialized arable systems or from regions dominated by permanent grasslands (as per the Commission's report), which structurally include fewer classes of crops.
Regional differences. The spatial distribution shows clear regional differences: areas of high diversity are mainly found in southeastern France, central Italy, northeastern Spain, and parts of southern Germany, western Poland, and eastern Croatia. Areas of least diversity are observed in southern Greece, north-western Spain, south-western France and northern Italy. The report highlights that low-diversity areas also include pasture-dominated livestock systems, where low diversification reflects pastoral land use rather than crop simplification. Countries such as Spain, Italy and Portugal show high diversity, while others, such as Czechia, Denmark and Hungary, show more uniform patterns.
Dominant pasture. Looking at the assessment of the most represented crop at the local level, the report shows the predominance of grazing, which is the dominant land use in just over half of the LAUs (50.5%), and also reflects extensive livestock farming systems (especially in Ireland, Portugal, the Netherlands and mountainous regions). Wheat (31.1%) is the second most represented crop and is mainly grown in northern France, the Danube basin, central Germany and the Italian Adriatic. It is followed by corn (8.6%), barley (3.2%), viticulture (2.3%) and olive growing (1.1%). As mentioned, there is no shortage of highly diversified lands. In 2023, 25% of the total agricultural area of the EU-27 was located in LAUs with more than 5.9 types of evenly distributed crops. These areas of particular interest for agri-environmental policies are located in central-northern France, along the Italian Adriatic coast, in much of Germany, in western Poland and in eastern Romania. These are counterbalanced by areas of low diversity. Just over a quarter (25.2%) of the total area was in LAUs with fewer than 3.4 crop types and 21% of NUTS-4/LAU regions show a diversity of less than 1.5 crop types, a value indicative of near monoculture. Many of these areas simply reflect landscapes dominated by pastures, which the Commission does not consider negative in the approach to sustainable agriculture. While low-diversity areas dominated by intensive arable crops (such as regions with predominantly wheat and corn crops in northern France, the Po Valley and the Danube basin) represent areas susceptible to targeted EU support for crop diversity.
The report highlights some positive trends. The total area of low-diversity landscapes decreased by 2.8% (from 24.8 to 22.3 million hectares) at the European level. The largest reductions were observed in Malta (-31.4%), Cyprus (-12.2%), Italy (-4.8%) and Belgium (-4.6%), indicating a move towards more diversified systems. Increases in low-diversity areas were reported in Luxembourg (+6.4%), Bulgaria (+1.4%) and Slovakia (+0.3%).
Italy is improving. Most NUTS3 regions fall into stable or slightly changing classes. Among the positive increases in diversity, the report highlights France (Atlantic coast and Paris Basin), central Germany, Italy (Lombardy, Veneto, Apulia, Sicily, Calabria), Czechia, and eastern Slovakia. While decreases were recorded in Spain (Andalusia and Aragon), Denmark, eastern Croatia, the Danube Plain, parts of Italy (Piedmont and Marche), southern Germany, Lithuania and Latvia. Some specific local trends are highlighted by the EU analysis, which shows how the 2018 drought in Lombardy temporarily led to the replacement of water-demanding rice with other crops. A significant passage of the report highlights how the comparison between satellite measurements (Copernicus) and data from surveys (FADN/RICA) reveals a strong correlation between the crop diversity index at the landscape level and that aggregated at farm level for NUTS3 regions. The main divergences occur in areas dominated by vineyards or horticulture: wineries are typically specialized (low farm diversity in FADN), but the surrounding landscape may include a mix of crops (higher diversity in Copernicus). This, according to the report, attests to the complementarity between satellite observation and management data reported by agricultural companies. This report will influence ongoing discussions on the post-2027 CAP, in which soil protection practices (through rotation or diversification) should be complemented by targeted agri-environmental and climate actions.


