Agricultural technologies: sales increase in the U.S.
Tractors close 2020 with a 17.7% increase, combines 5.5%. The market is benefiting from the flywheel effect induced by the increase in federal aid, which reached a new high of $37 billion. The first estimates for 2021 show positive results
The U.S. closes 2020 with strong growth in the agricultural machinery sector. In a year still difficult for the U.S. economy, affected by the pandemic of Covid 19, the U.S. agromechanical sector went against the trend, recording double-digit increases for tractor sales (+17.7% compared to the same period in 2019, due to more than 288 thousand registered machinery), and smaller, but still considerable, increases for combine harvesters, which, with 5,056 registrations, scored +5.5%. AEM, the American Agricultural Equipment Manufacturers Association, released its year-end report in January 2021. In the tractor sector, those benefiting from this growth were mainly the low (up to 40 horsepower) and medium horsepower (40 to 100 horsepower) classes, which respectively increased by 21% and 13.8%. Although slightly (+3.2%), there is also growth in the power classes above 100 horsepower, with a total of 19,165 registrations (there were 18,562 in 2019). As the AEM report shows, the tractor and combine harvester sector's upward trend began in March. It continued uninterruptedly in the following months, with volumes significantly higher than those of 2019 and the average of the last five years, i.e., the period between 2015 and 2019. These five years were characterized by a fluctuating trend in market values, with a series of growth and contraction phases, at levels that were in any case far from the records reached in the three years 2012-2014 (17 billion euros per year).
The driving force of federal funds
A substantial federal aid package, launched in the pandemic aftermath, contributed to driving sales last year. According to an analysis of the U.S. market carried out by the Houston (Texas) office of the ICE Agency and presented last November on the occasion of EIMA Digital Preview, in 2020, the federal government's incentives for farmers will reach the threshold of 37 billion dollars, the largest allocation since 2010. According to the ICE Agency study, in 2021, tractors' sales and combine harvesters are not expected to show significant deviations from the trend that has emerged in recent months. A climate analysis conducted among U.S. dealers of agricultural machinery is mentioned for this purpose, whose market sentiment is considered an essential indicator of the sector's trends in the short and medium-term. According to this analysis, 50% of U.S. dealers expect the year that has just begun to remain at the same sales figures as 2020, while an equally large proportion - 40% - expect business to grow by more than 2%. " Only 11% of dealers "see a gloomy outlook", for whom turnover could fall by between 2% and 7%. Compared to 2020, the sector's forecasts for 2021 show a significant improvement in sentiment, with a substantial reduction in "pessimists" (21% of U.S. dealers in 2020). This is also confirmed by the pre-orders trend (for the August-October 2020 quarter), which are at their highest level since 2015, with a third of dealers expecting increases of over 1%. Still, according to dealers, loaders, precision farming, precision farming systems and landscaping technologies are likely to be the bestselling product categories for 2021.
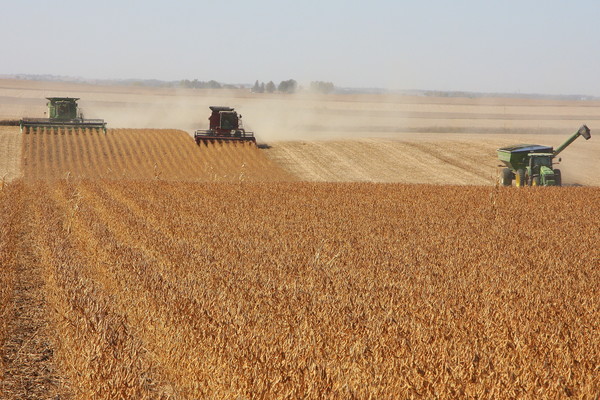
Tractors and self-propelled machinery: the geography of the U.S. market
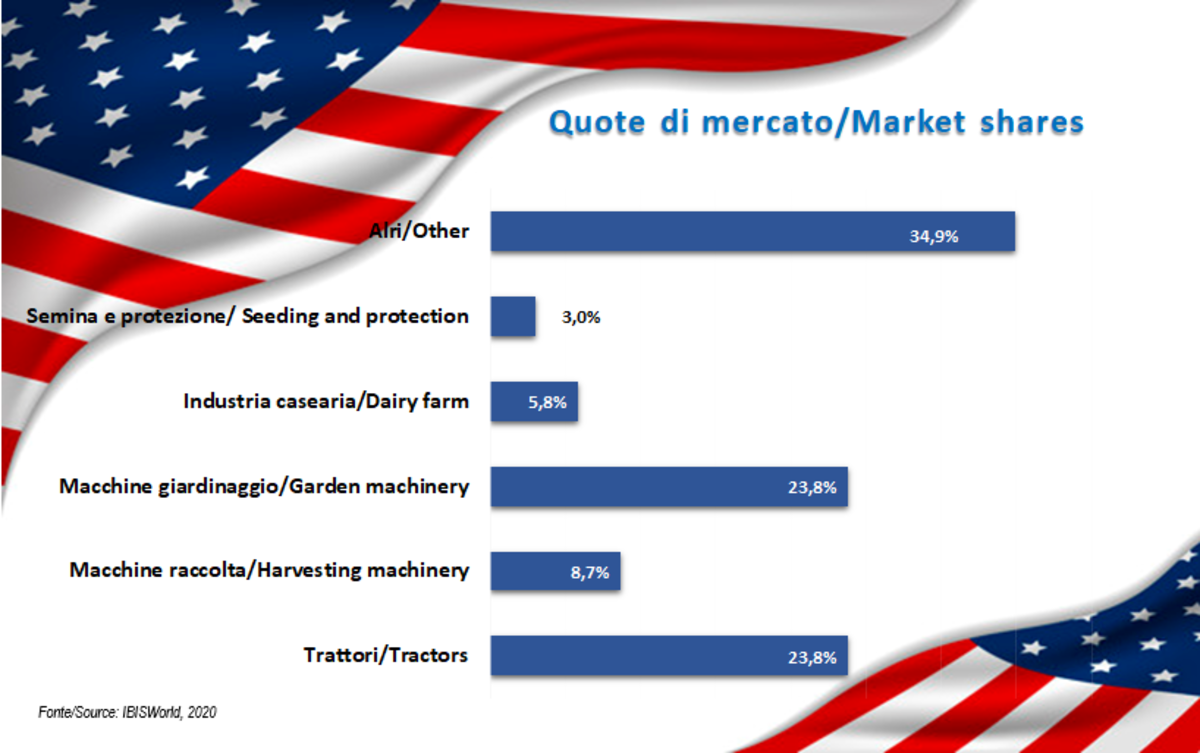
With more than 2 million active farms with an average size of 180 hectares (for a total agricultural surface area of 364 million hectares), the American primary sector has its production core in the Midwest - 370 billion euros in 2019, including livestock farming. Six out of the nine U.S. states with the highest agricultural vocation (Iowa, Nebraska, Kansas, Minnesota, Illinois, Wisconsin) are, in fact, located in the central-northern regions of the country. In addition to these, California (home to 50% of all U.S. vineyards) ranked first in terms of revenue, Texas (third-largest U.S. producer), and, in a more distant position, North Carolina. Considering the turnover figure, corn, soybeans, fruits and vegetables were the most profitable crops of 2019, followed by wheat, hay and cotton. Needless to say, "agricultural" States are also those that, as the ICE Agency report shows, tend to invest more in mechanical means and technologies for agriculture. In fact, 42% of all investments made in 2109 - total spending amounted to 19 billion dollars (11.9 on tractors and 5.1 on agricultural machinery) - are concentrated in just ten States, most of which are among the country's leading producers. Texas (1.3 billion), Iowa (1.1 billion) and Illinois (1 billion) lead the "ranking" of investors, followed by Minnesota and Missouri. Instead, the national agricultural machinery production is mainly focused on tractors, harvesting equipment, livestock equipment and sowing machines, which in terms of turnover, according to 2020 data reported by the ICE Agency, represent 40% of the market. Also of paramount importance to U.S. manufacturers is the gardening segment, which boasts a revenue share of about 24% of the total. Also of significance is the weight of imports, which hit $7.8 billion in 2019 (the first nine months of 2020 show a 1% decline). The ranking of U.S. suppliers, covering the three years 2017-2019, has Canada, Germany and Japan at the top. Italy ranks seventh, with Made in Italy increasing its market share (6% for a total value of exports to the U.S. of 472 million dollars). FederUnacoma recalled that the United States is the third-largest foreign market for Italian agricultural machinery manufacturers, after France and Germany. Demand is mainly driven by harvesting machinery, tractors, sowing, fertilizing and transplanting implements, and breeding machinery. The export trend in the first seven months of the year, characterized by a drop in value of 7.5%, should be assessed with particular attention. As a matter of fact, it remains to be seen to what extent this contraction is due to a change in U.S. demand for Italian machinery and to what extent it may be related to the halt in production activities decided by the Italian government last spring to fight the spread of the Covid 19 pandemic.


